Executive Summary
The Story So Far
Why This Matters
Who Thinks What?
The combined market value of the United States’ ‘Magnificent Seven’ tech giants reached $20.8 trillion as of October 2, 2025, officially surpassing the European Union’s total economic output of $19.4 trillion. This significant milestone, driven by a sustained rally in technology stocks, has intensified a global debate over whether the market is experiencing a profound structural economic shift or is showing early signs of a new tech bubble.
Market Dynamics and Scale
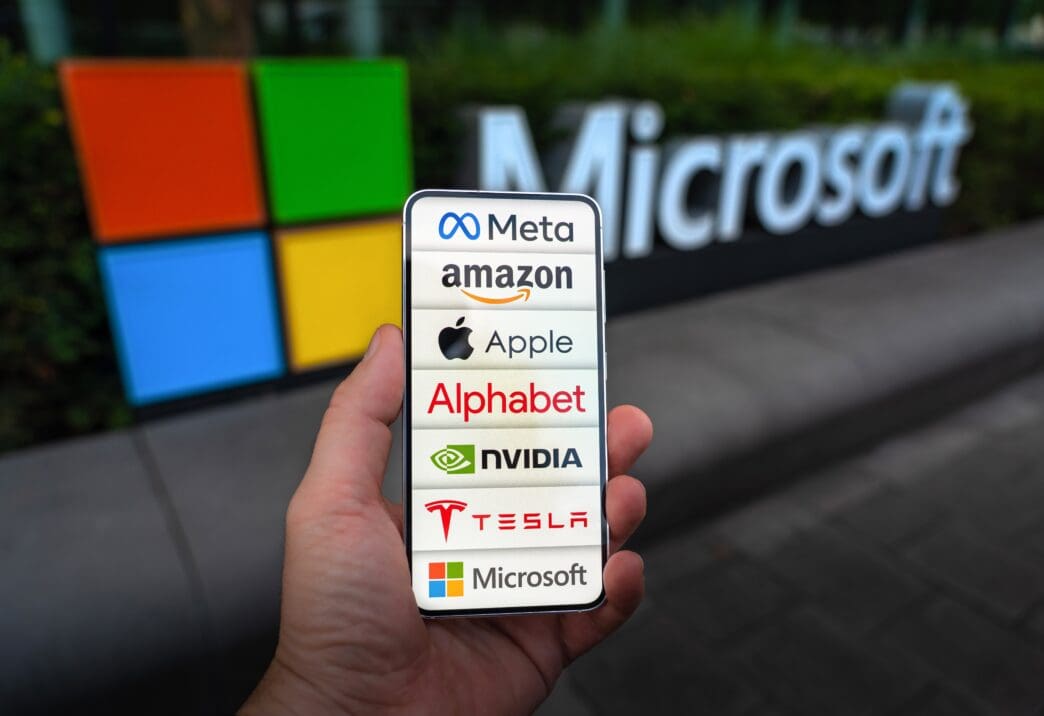
The seven leading US tech companies—Nvidia, Microsoft, Apple, Alphabet, Amazon, Meta, and Tesla—now collectively command a market capitalization that eclipses the entire EU economy. Nvidia alone, which has become the world’s most valuable company, boasts a market valuation of approximately $4.3 trillion, a figure comparable to the Gross Domestic Product of Germany, Europe’s largest economy.
This extraordinary concentration of value fuels questions about the nature of the current market environment. Analysts are weighing whether this represents a fundamental reshaping of global capitalism or if it reflects unsustainable market exuberance.
Defining a Tech Bubble
A tech bubble is typically characterized by a significant disconnect between market prices and the underlying economic reality or business fundamentals. It involves widespread speculative fervor, excessive investor optimism, and the belief in limitless profits from rapid technological change, often without regard for earnings or sustainable business models.
Renowned economist Robert Shiller described bubbles as periods of “social contagion,” where narratives of quick riches fuel mass enthusiasm and attract more investors, driving prices higher irrespective of fundamentals. Economist Hyman Minsky argued that during euphoric booms, speculation becomes the dominant market force, with asset prices increasingly justified by narratives rather than data, eventually leading to a sharp correction.
Structural Shift Versus Speculative Mania
Jordi Visser, senior managing director and head of macro research at 22V Research, contends that labeling the current rally a “bubble” oversimplifies the situation. He posits that what is unfolding is a “structural arms race” in artificial intelligence, driven by deep investments from governments and corporations as a matter of national and economic security.
Visser suggests that AI is accelerating a decades-long process of economic concentration, where wealth and innovation consolidate into fewer entities. He notes that while “bubbles lift everyone into euphoria; concentration leaves most behind,” highlighting a key distinction from past speculative booms.
Signs of Heightened Risk
Despite arguments for a structural shift, certain indicators suggest heightened market risk. The rapid speed of capital inflows into AI-themed exchange-traded funds, the speculative rise of smaller-cap AI firms, and the dominance of a few megacaps over the broader market are points of concern. These dynamics may not signal a full-blown bubble but do indicate elevated investor sentiment.
History also provides cautionary tales; the fates of former market leaders like AOL, BlackBerry, and Yahoo! serve as reminders that even in technological revolutions, not every firm sustains its leadership position long-term.
Comparison to the Dot-Com Era
To assess the extent of current market euphoria, it is useful to compare it to the dot-com bubble of the late 1990s. The current tech rally, which began with the launch of OpenAI’s ChatGPT in November 2022, has seen the Nasdaq 100 index surge by 140% in under three years.
This growth, while substantial, is still modest when compared to the dot-com era, where the Nasdaq 100 climbed more than 500% in the three years leading up to its March 2000 peak. By this measure, the current market has not yet reached the same level of explosive price acceleration.
Valuation Metrics
Traditional valuation metrics, such as the forward price-to-earnings (P/E) ratio, also offer perspective. Most of the Magnificent Seven companies currently trade with forward P/E ratios ranging from 24.8x (Alphabet) to 33.3x (Apple).
Tesla stands out as an outlier, with a forward P/E of 220.0x, making it one of the highest in the Nasdaq 100. However, excluding Tesla, the collective valuations of the remaining six companies are actually lower than the broader Nasdaq 100 index, which currently trades above 40x forward earnings. This suggests that while valuations are high, they do not yet reflect the widespread, frothy excesses of the dot-com bubble across the entire group.
Key Takeaways
The current tech rally is remarkable in its scale and symbolic significance, with the market value of the top seven tech companies now exceeding the EU’s economic output. This underscores a notable shift in global economic power towards the digital sector. While some market indicators point to heightened risk, traditional measures of euphoria, such as explosive price increases and irrational valuations across the board, do not yet align with the extremes of the dot-com peak. The ongoing challenge for policymakers and investors alike is to discern the fine line between genuine structural transformation and speculative market behavior.


