
Executive Summary
The Story So Far
Why This Matters
Who Thinks What?
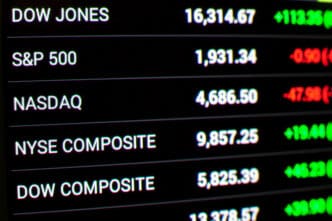
The S&P 500 index has reached an all-time high this year, alongside the Nasdaq Composite and Dow Jones, but a key valuation metric suggests the market is entering historically expensive territory. As of October 24, 2025, the Shiller price-to-earnings (P/E) ratio for the S&P 500 stands at approximately 40, marking only the third time in history this level has been reached, a phenomenon that has previously preceded significant market downturns.
Market Reaches New Highs Amidst Valuation Concerns
Despite an earlier period of volatility attributed to the Trump administration’s tariff plan, the U.S. stock market’s three major indexes have posted strong gains year-to-date through October 21. The S&P 500 has climbed 14.7%, the Nasdaq Composite is up 19%, and the Dow Jones has risen 10.8%. These advances have brought the indexes to all-time highs.
The Shiller P/E Ratio as a Valuation Indicator
One of the metrics used to assess the S&P 500’s valuation is the Shiller P/E ratio, also known as the Cyclically Adjusted Price-to-Earnings (CAPE) ratio. Unlike the standard P/E ratio, the Shiller P/E uses inflation-adjusted earnings per share averaged over the previous 10 years. This method aims to provide a more stable and balanced view of market valuation, smoothing out temporary economic fluctuations.
Historical Context of High Valuations
The current Shiller P/E ratio of around 40 places the S&P 500 at its third most expensive point in history. The two prior instances when the ratio surpassed 40 were in late 1999, during the dot-com bubble, and in January 2022, amid a bull run fueled by the COVID-19 pandemic. Both periods were followed by significant market corrections; the Nasdaq Composite declined by approximately 78% after the 1999 peak, and the S&P 500 finished 2022 down over 19%.
Outlook and Investor Considerations
Currently, the S&P 500 is trading at a 124% premium compared to its historical average. While past performance does not guarantee future results and short-term market movements are unpredictable, the elevated Shiller P/E ratio suggests an increased likelihood of a market correction or pullback. However, the author of the article, Stefon Walters, advises against panic, noting that the market has historically demonstrated resilience and tends to recover over the long term, with bear markets typically being shorter than bull markets.
For investors nearing retirement, diversifying holdings may be a prudent step to mitigate risk should a correction occur close to when funds are needed. Additionally, for those still looking to invest in the S&P 500, considering an equal-weight S&P 500 exchange-traded fund (ETF) could reduce concentration risk by distributing investments more evenly across all index components, rather than heavily weighting larger technology companies.
Summary of Key Takeaways
The U.S. stock market’s recent all-time highs coincide with the S&P 500 reaching a historically high Shiller P/E ratio of 40, a level previously associated with market downturns. While this valuation suggests an increased potential for a correction, long-term investors are encouraged to consider diversification and strategic investment approaches rather than reacting with panic, acknowledging the market’s historical capacity for recovery.


