
Executive Summary
The Story So Far
Why This Matters
Who Thinks What?
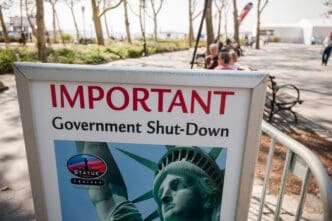
The U.S. government has entered its fourth week of a shutdown, marking it as the second-longest in American history and impacting approximately 900,000 federal workers who are not receiving paychecks or essential services. Despite the ongoing disruption, the benchmark S&P 500 index has remained largely stable since the shutdown began on October 1, showing oscillations but no significant overall decline.
Impact on Federal Workers
The prolonged shutdown has led to significant hardship for nearly a million federal employees, many of whom have been furloughed without pay. This situation has also disrupted various government services, affecting individuals relying on them.
As of the article’s writing, the shutdown has surpassed three weeks, causing financial strain for those directly impacted.
Historical Market Performance During Shutdowns
Historically, the stock market’s performance during government shutdowns has shown no consistent pattern. According to research from The Motley Fool, over 20 federal shutdowns and funding gaps between 1976 and 2020 have seen market reactions ranging from a 4.4% loss to a 10.3% gain.
However, most shutdowns occurring after 1990 have been associated with market gains while they were ongoing.
Market Performance After Shutdowns
Data from CNBC.com and Morningstar suggests that the stock market has generally performed well in the periods immediately following the end of previous government shutdowns. For instance, after the longest shutdown on record, from December 22, 2018, to January 25, 2019, which occurred during President Donald Trump’s administration, the S&P 500 index gained 18% within the first 100 days and an impressive 36% a year later.
Similarly, following the third-longest shutdown, from December 16, 1995, to January 6, 1996, under President Bill Clinton, the stock market saw a 6.2% gain in the first 100 days and a 26% increase within the first year.
However, this trend is not universal. A year after a three-day shutdown in January 2018, also during the Trump presidency, the S&P 500 was down 3%. Additionally, after a four-day shutdown in November 1981, the S&P 500 declined by 5.5% in the subsequent 100 days.
Current Economic Context
The current shutdown is unfolding amidst a complex economic landscape characterized by high tariffs, trade tensions, and broader concerns about inflation and the job market. These unique circumstances differentiate it from previous shutdowns.
Conversely, expectations for continued falling interest rates could provide a positive impetus for the stock market, as lower borrowing costs typically benefit both companies and consumers.
Outlook
While historical data offers some encouraging insights into potential stock market behavior post-shutdown, there are no guarantees. Each shutdown occurs under distinct economic and political conditions, and the stock market remains inherently volatile.


