Executive Summary
The Story So Far
Why This Matters
Who Thinks What?
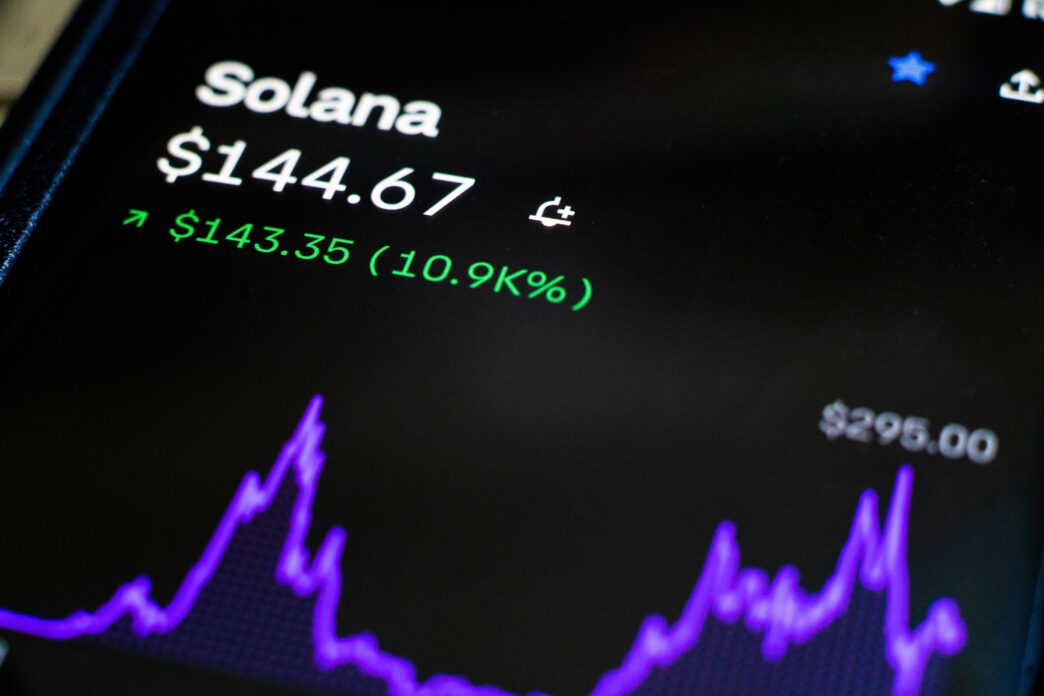
Solana (SOL) experienced a significant price drop to a five-month low of $142 on Friday, November 15, 2025, despite a continuous 13-day streak of inflows into spot Solana Exchange-Traded Funds (ETFs) totaling $370 million. This downturn, which saw the token fall 34% over a two-week period, reflects broader market weakness and technical breakdowns, even as institutional interest in Solana ETFs continues to grow.
Market Performance and ETF Activity
The cryptocurrency, SOL, reached its lowest price point since June 23. This decline occurred despite spot Solana ETFs recording their thirteenth straight day of net inflows on Thursday, adding $1.49 million and bringing their total cumulative inflows to $370 million since their launch on October 28. Total assets under management for these funds now exceed $533 million.
The Bitwise Solana ETF was the sole fund to record inflows on Thursday, marking the weakest day for Solana ETF inflows since the products debuted. Currently, four Solana ETFs are actively trading, with approximately ten additional funds awaiting regulatory approval.
The broader crypto market also showed signs of weakness, with Bitcoin ETFs recording $866 million in net outflows and Ethereum ETFs posting $259.2 million in outflows on the same day. This widespread decline suggests a prevailing cautious sentiment among investors.
VanEck’s Progress and Technical Breakdown
Amidst the market volatility, VanEck is progressing towards launching its own Solana ETF. The firm submitted an 8-A form to the Securities and Exchange Commission (SEC) this week, following its S-1 filing in late October, indicating that the fund’s launch may be imminent.
From a technical perspective, SOL has broken below its 100-week simple moving average and a multi-year uptrend line that had been in place since January 2023. The token is currently testing a daily order block around $140, with its yearly low sitting at $95.
Data from Glassnode indicates limited support at the current $140 level, suggesting fewer holders are likely to defend the price. The next significant support level for Solana is anticipated around the 200-week moving average at $100, which represents a potential 29% drop from current levels. The relative strength index (RSI) has also fallen to its lowest reading since April 2025, signaling persistent selling pressure.
On-Chain and Trendline Analysis
On-chain analysis from Ali Martinez further supports the view of weakening support, particularly below $144. His data highlights heavy realized volume between $150 and $180, with a final support pocket identified at $144.54 before a potential move to much lower prices.
Analyst Cryptorphic noted that a five-year trendline is now under direct pressure, with SOL hovering near $142 and approaching a stronger support band between $125 and $135. This zone has been crucial to Solana’s recovery structure since 2020.
A rebound from the $125-$135 area could potentially propel the price towards $196 and $249. However, a weekly close below $135 may expose deeper weakness, with some analysts pointing to $93 as a possible downside target if current support levels fail.
Despite the mounting price pressure, Grayscale’s GSOL ETP has recorded heavy trading volume, maintaining investor attention even as its value has decreased by approximately 30% over the past month. All four active Solana ETFs have managed to avoid a single day of net redemptions since their launch.
Outlook
As Solana traded at $138.50 at press time following an 11% daily decline, the token faces a critical test at these levels. Both technical and on-chain indicators suggest limited support below the $140 mark, highlighting a pivotal moment for the cryptocurrency’s near-term trajectory.


