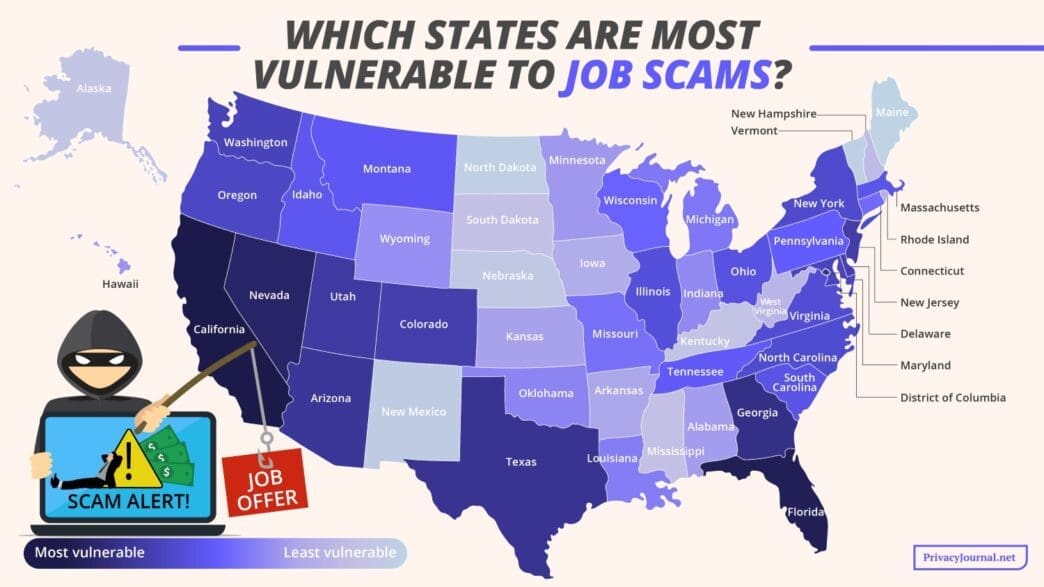
California faces the highest risk of job scams in the United States, followed closely by Florida and Nevada, according to the Federal Trade Commission’s (FTC) 2024 data book. The report highlights a staggering loss of $751 million attributed to business and job opportunity scams, ranking job scams as the third most reported fraud type, trailing only imposter and online shopping scams. To better understand the impact on job seekers, PrivacyJournal.net conducted research using FTC data to analyze job scam reports, financial losses, growth rates, and unemployment statistics, ranking states from most to least vulnerable.
Key Findings: Job Scams Across the U.S.
- High-Risk States: California tops the list as the state most susceptible to job scams, with Florida and Nevada also ranking high. Georgia and Texas are among the top ten.
- Low-Risk Rural States: Maine, Vermont, and North Dakota, known for their rural landscapes, show the least vulnerability to job scams.
- Regional Growth Trends: Montana, Idaho, and Delaware saw the most significant increase in job scam reports from 2022 to 2024.
- Financial Losses: California leads with over $81.8 million lost to scams in 2024, followed by Florida and Texas.
- Unemployment Rate Disparity: States like Nevada, California, and Washington, D.C. show high unemployment rates and are more prone to scams.
U.S. States With the Highest Job Scam Risk
California suffers the heaviest financial losses and holds the second-highest unemployment rate, making it a prime target for scams. Factors like a large immigrant population and significant living costs contribute to its vulnerability. Florida’s ranking, despite a lower unemployment rate, suggests its vast population and living expenses play a role. Nevada’s high unemployment rate and job scam reports per million underline its position as a high-risk state.
Ranking U.S. States’ Vulnerability to Job Scams
| Ranking | State | Final Weighted Score | Job Scam Reports per Million People | Job Scam Loss ($) per State | Growth Rate of Reports per Million People (2022-2024) | Percentage Change in Total $ Loss (2022-2024) | Unemployment Rate by State |
|---|---|---|---|---|---|---|---|
| 1 | California | 65.789 | 12 | 1 | 24 | 23 | 2 |
| 2 | Florida | 65.225 | 3 | 2 | 6 | 26 | 31 |
| 3 | Nevada | 60.280 | 1 | 20 | 10 | 11 | 1 |
| 4 | District of Columbia (D.C.) | 57.126 | 2 | 38 | 15 | 12 | 3 |
| 5 | Georgia | 51.759 | 4 | 6 | 13 | 9 | 29 |
| 6 | Texas | 50.652 | 11 | 3 | 29 | 28 | 17 |
| 7 | Arizona | 48.095 | 6 | 8 | 16 | 16 | 25 |
| 8 | Utah | 47.005 | 5 | 17 | 7 | 14 | 34 |
| 9 | New Jersey | 44.267 | 13 | 5 | 14 | 8 | 8 |
| 10 | Colorado | 43.539 | 7 | 14 | 21 | 33 | 11 |
| 11 | Delaware | 43.092 | 9 | 39 | 2 | 39 | 22 |
| 12 | Washington | 41.514 | 15 | 7 | 11 | 6 | 8 |
| 13 | Maryland | 39.479 | 8 | 10 | 42 | 32 | 40 |
| 14 | Oregon | 38.802 | 16 | 21 | 4 | 17 | 15 |
| 15 | New York | 37.591 | 17 | 4 | 41 | 25 | 11 |
| 16 | North Carolina | 37.121 | 14 | 12 | 17 | 27 | 25 |
| 17 | Virginia | 36.908 | 10 | 11 | 22 | 40 | 46 |
| 18 | Illinois | 34.736 | 18 | 9 | 20 | 31 | 5 |
| 19 | Ohio | 29.734 | 26 | 15 | 19 | 7 | 11 |
| 20 | South Carolina | 29.492 | 19 | 18 | 26 | 30 | 17 |
| 21 | Massachusetts | 27.965 | 28 | 16 | 12 | 35 | 21 |
| 22 | Idaho | 27.923 | 27 | 35 | 3 | 43 | 22 |
| 23 | Montana | 27.601 | 30 | 49 | 1 | 44 | 40 |
| 24 | Tennessee | 26.073 | 20 | 19 | 32 | 42 | 31 |
| 25 | Pennsylvania | 24.907 | 21 | 13 | 40 | 36 | 25 |
| 26 | Wisconsin | 24.647 | 44 | 28 | 5 | 20 | 40 |
| 27 | Connecticut | 23.970 | 23 | 27 | 36 | 13 | 34 |
| 28 | Missouri | 23.777 | 22 | 24 | 33 | 29 | 22 |
| 29 | Michigan | 23.700 | 25 | 23 | 31 | 46 | 6 |
| 30 | Louisiana | 23.044 | 34 | 26 | 39 | 5 | 10 |
| 31 | Oklahoma | 22.57 | 32 | 29 | 25 | 22 | 33 |
| 32 | Indiana | 22.388 | 39 | 22 | 44 | 4 | 15 |
| 33 | Wyoming | 22.125 | 24 | 41 | 37 | 18 | 34 |
| 34 | Hawaii | 21.783 | 43 | 32 | 18 | 15 | 40 |
| 35 | Minnesota | 21.145 | 40 | 25 | 23 | 19 | 40 |
| 36 | Alabama | 20.970 | 29 | 30 | 35 | 34 | 38 |
| 37 | Kansas | 19.742 | 35 | 44 | 27 | 41 | 25 |
| 38 | Arkansas | 19.730 | 31 | 37 | 28 | 45 | 29 |
| 39 | Iowa | 18.784 | 47 | 31 | 8 | 24 | 40 |
| 40 | Rhode Island | 17.498 | 41 | 51 | 30 | 48 | 11 |
| 41 | West Virginia | 17.357 | 42 | 45 | 34 | 37 | 17 |
| 42 | New Hampshire | 17.159 | 37 | 43 | 43 | 21 | 48 |
| 43 | South Dakota | 16.926 | 50 | 46 | 9 | 2 | 51 |
| 44 | Mississippi | 16.381 | 36 | 42 | 38 | 49 | 34 |
| 45 | Kentucky | 15.698 | 45 | 33 | 45 | 47 | 4 |
| 46 | Alaska | 15.611 | 38 | 47 | 47 | 38 | 7 |
| 47 | Nebraska | 13.720 | 46 | 36 | 46 | 3 | 47 |
| 48 | New Mexico | 13.218 | 33 | 34 | 51 | 51 | 17 |
| 49 | North Dakota | 11.155 | 51 | 40 | 50 | 1 | 49 |
| 50 | Vermont | 6.420 | 49 | 48 | 48 | 10 | 50 |
| 51 | Maine | 5.348 | 48 | 50 | 49 | 50 | 38 |
Table Notes: The job scam reports and associated financial losses encompass the following categories: business and work-from-home opportunities, job scams involving employment agencies, and pyramid and multi-level marketing schemes.
- Business and Work-from-Home Opportunities: These scams often lure victims with promises of quick and easy financial gain, leading them to pay fees or disclose sensitive personal information upfront.
- Job Scams and Employment Agencies: Scammers may create fraudulent job listings for positions that do not exist, aiming to extract money or personal details from unsuspecting individuals.
- Pyramid and Multi-Level Marketing Schemes: This type of scam deceives victims into believing they can earn money by recruiting others, perpetuating a cycle of false promises and exploitation.
States Ranked Safest for Job Seekers
Maine, with a low population density and rural landscape, is the least vulnerable. Vermont and North Dakota, despite showing high financial loss percentage changes, remain low-risk due to their smaller populations.
Job Scam Report Growth and Financial Loss Trends
Montana, Idaho, and Delaware showed the highest growth in job scam reports, indicating a regional spread of scams. Conversely, New Mexico, North Dakota, and Maine displayed minimal growth, suggesting effective measures against such fraud.
Understanding Job Scams
Job scams typically lure victims with false job postings, extracting money or personal information under the guise of employment opportunities. Scammers may also trick individuals into working for free or offering payments for job-related expenses.
Identifying Employment Scams:
- Offers that seem too good to be true.
- Minimal job application procedures.
- Requests for payment or personal information.
- Professional communication and online presence discrepancies.
Common Fake Job Listings and Types:
- Data-entry and easy online task scams.
- Pyramid schemes requiring upfront payment.
- Fake postal service jobs demanding payment for training.
- Scams using messaging apps for communication.
Reporting Job Scams
If you have been scammed, contact your bank or local authorities if you provided financial information. For social security-related scams, report via IdentityTheft.gov, and send scam reports to ReportFraud.ftc.gov. International victims should consult local fraud-reporting agencies.
The Everyday Impact: Navigating Job Scams
- Community Resilience: As communities become more informed about scams, collective vigilance can deter scammers and safeguard local economies.
- Financial Security: With $751 million lost, job scams pose a significant threat to financial stability for individuals and states.
- Job Market Integrity: High scam rates may erode trust in legitimate job opportunities, affecting employment rates and workforce morale.
- Regional Disparities: States with high unemployment face greater risk, highlighting the need for targeted awareness and preventive measures.
- Scam Awareness: Increasing scam awareness campaigns can reduce vulnerability by educating job seekers on identifying fraudulent offers.
- Policy Implications: Governments may need to enhance regulatory frameworks to protect citizens from job fraud, ensuring a safer job market.
Research Conducted by PrivacyJournal.net: This study was conducted by PrivacyJournal.net, utilizing data from the Federal Trade Commission to analyze job scams and their financial impacts.